
Every Part Passed Inspection. Is the Process Still in Control?
A passing inspection result tells you whether the measured part met its specification. It does not, by itself, tell you whether the process will keep producing acceptable parts.
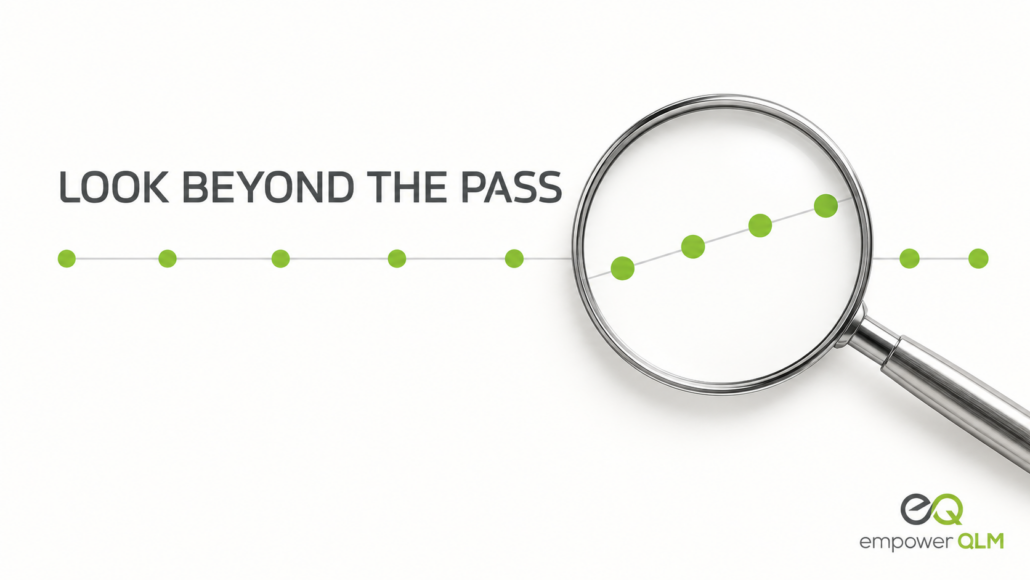
Consider a production line measuring the same critical characteristic throughout a shift. Every sampled part fall within the drawing tolerance. The inspection report looks clean. But the readings are gradually moving in one direction.
No part has failed yet. Is there a problem worth investigating?
For plant quality and manufacturing teams, this is where inspection and statistical process control (SPC) answer different questions. Inspection checks the product against its requirements. SPC helps teams understand whether the process producing that product is behaving consistently.
Passing Parts Can Still Signal a Changing Process
Specification limits define what is acceptable for a product characteristic. Control limits are calculated from process data and help teams identify behavior that differs from the process’s established pattern. They serve different purposes. A measurement can meet the specification while a control chart signals that the process needs attention. The NIST engineering statistics handbook explains this distinction.
That does not mean every upward or downward movement is a defect in the making. Processes vary. The question is whether the observed pattern is consistent with expected variation or suggests a change that warrants investigation.
A shift in measurements could lead a team to check tool wear, material, equipment settings, the inspection method, or another potential cause. The appropriate response depends on the characteristic, the evidence, and the reaction plan in place. Waiting for the first failed part can mean waiting longer than necessary to understand what changed.
Inspection Data Is More Useful When Teams Can Follow It Over Time
An individual inspection record has a job to do: document what was checked, what was measured, and whether the result met the requirement. Its value grows when the team can also examine results across production runs, work centers, parts, and batches.
A quality engineer looking at a series of results should be able to ask:
● Are measurements moving toward a specification limit?
● Does a control chart show a signal that calls for investigation?
● Is the pattern limited to one machine, shift, supplier, or batch?
● Were the measurements taken using a suitable, consistent method?
● What action was taken, and did the subsequent data show improvement?
These questions move the conversation beyond “Did this sample pass?” They help the team decide whether the process needs attention while there is still time to respond.
Check the Measurement Before Acting on the Trend
A surprising chart is a reason to investigate, not proof that the manufacturing process has changed.
Measurement equipment, methods, and people can contribute variation to the results. If the measurement system is unreliable for the characteristic being monitored, the team may struggle to distinguish a real process change from variation in the measurement itself.
Measurement system analysis (MSA) helps establish how much confidence to place in the data. SPC then helps the team assess process behavior. Both matter when a decision could affect production, containment, or process adjustments.
Process capability is another related question. Once a process is sufficiently stable to evaluate, capability analysis compares its output with specification limits. A handful of passing samples cannot establish that the process is capable of meeting requirements consistently.
Connect the Signal to an Action
A control chart has limited value if an unusual result stays on the chart and goes no further.
When data triggers an investigation, the team needs a clear path from the signal to a decision. That might mean confirming the measurement, checking the equipment, adjusting a process according to an approved procedure, increasing inspection, or initiating a nonconformance. The response should match the risk and the applicable control plan.
The team then needs to examine what happened afterward. Did the process return to its established pattern? Were affected parts assessed? Does the issue call for a change to the control plan, inspection instructions, or a broader corrective action?
This is where connected records matter. If the inspection result, process analysis, decision, and follow-up live in separate files or inboxes, it becomes harder to reconstruct why the team acted and whether the action worked.
How Empower QLM Supports the Work
Empower QLM’s Inspection Management and SPC capabilities support the connection between inspection results and process monitoring. Inspection Management provides configurable inspection templates and records, including measured values and control charts. The SPC module supports variable and attribute studies, process capability results, rules for analyzing
trends, and tracking actions when results do not meet requirements.
Related modules extend that workflow. Integrated lab and inline measurement recording can collect measurements and alert teams when readings exceed configured control or specification limits. MSA Software supports studies of the measurement system. When an investigation
identifies nonconforming product or calls for structured problem solving, the findings can be managed through Non-Conformity Management with CAPA and 8D.
The goal is straightforward: give teams a way to see what the measurements are saying, assess whether the signal is trustworthy, and document the response.
A Passing Result Is the Start of the Question
Inspection confirms whether the parts measured met their requirements. SPC adds context about how the process is behaving over time. Used together, they help quality teams recognize when a passing result deserves a closer look.
The most useful question after a clean inspection report may be: What does the pattern tell us about the next parts we will make?
Frequently Asked Questions
Can a process be out of control if all inspected parts meet specification?
Yes. Specification limits describe acceptable product values, while control limits help assess process behavior. A control chart can show a signal worth investigating even when the inspected parts remain within specification.
Does a passing inspection mean a process is capable?
No. Passing samples show that those measured parts met the requirement. Evaluating process capability requires appropriate process data and an assessment of whether the process is sufficiently stable for the analysis.
Where does MSA fit into SPC?
MSA helps teams assess the measurement system used to collect process data. If that system introduces too much variation, a chart may give a misleading picture of the process.
Does every SPC signal require an 8D?
No. The response depends on the signal, the characteristic, customer requirements, and the risk. A team may first verify the measurement and investigate the process. A significant or recurring issue may warrant a formal nonconformance or corrective action.
About Us
RGBSI’s quality division and EmpowerQLM software address the COPQ problems covered in this article through a combined services and platform model. RGBSI supports manufacturers with COPQ baseline studies, supplier chargeback recovery programs, PPAP and APQP execution support, supplier development, audits, 8D problem solving, and warranty-related quality services. These services help manufacturers identify hidden cost categories, quantify supplier-driven losses, and establish defensible recovery mechanisms.
EmpowerQLM provides the workflow infrastructure to operationalize that model. NC Management captures nonconformances at the point of failure. CoPQ Management links cost fields, chargeback workflows, and recovery status to NCs, 8Ds, CAPAs, PPAPs, and warranty records. Warranty Management connects field claims to financial exposure and recurrence analysis. Supplier Scorecards bring quality cost into supplier performance discussions. ERP and finance-system integration support debit and credit note tracking, so quality cost can move from hidden overhead to attributable financial governance.
Together, RGBSI and EmpowerQLM help enterprise manufacturers make COPQ visible, recoverable, and preventable. More detail on the services side is available through EmpowerQLM Quality Management Services.
Download Empower QLM Software Overview Brochure